

U.S. Freight Volume by Vehicle Type: The 50-State Breakdown That Every Shipper Needs in 2025
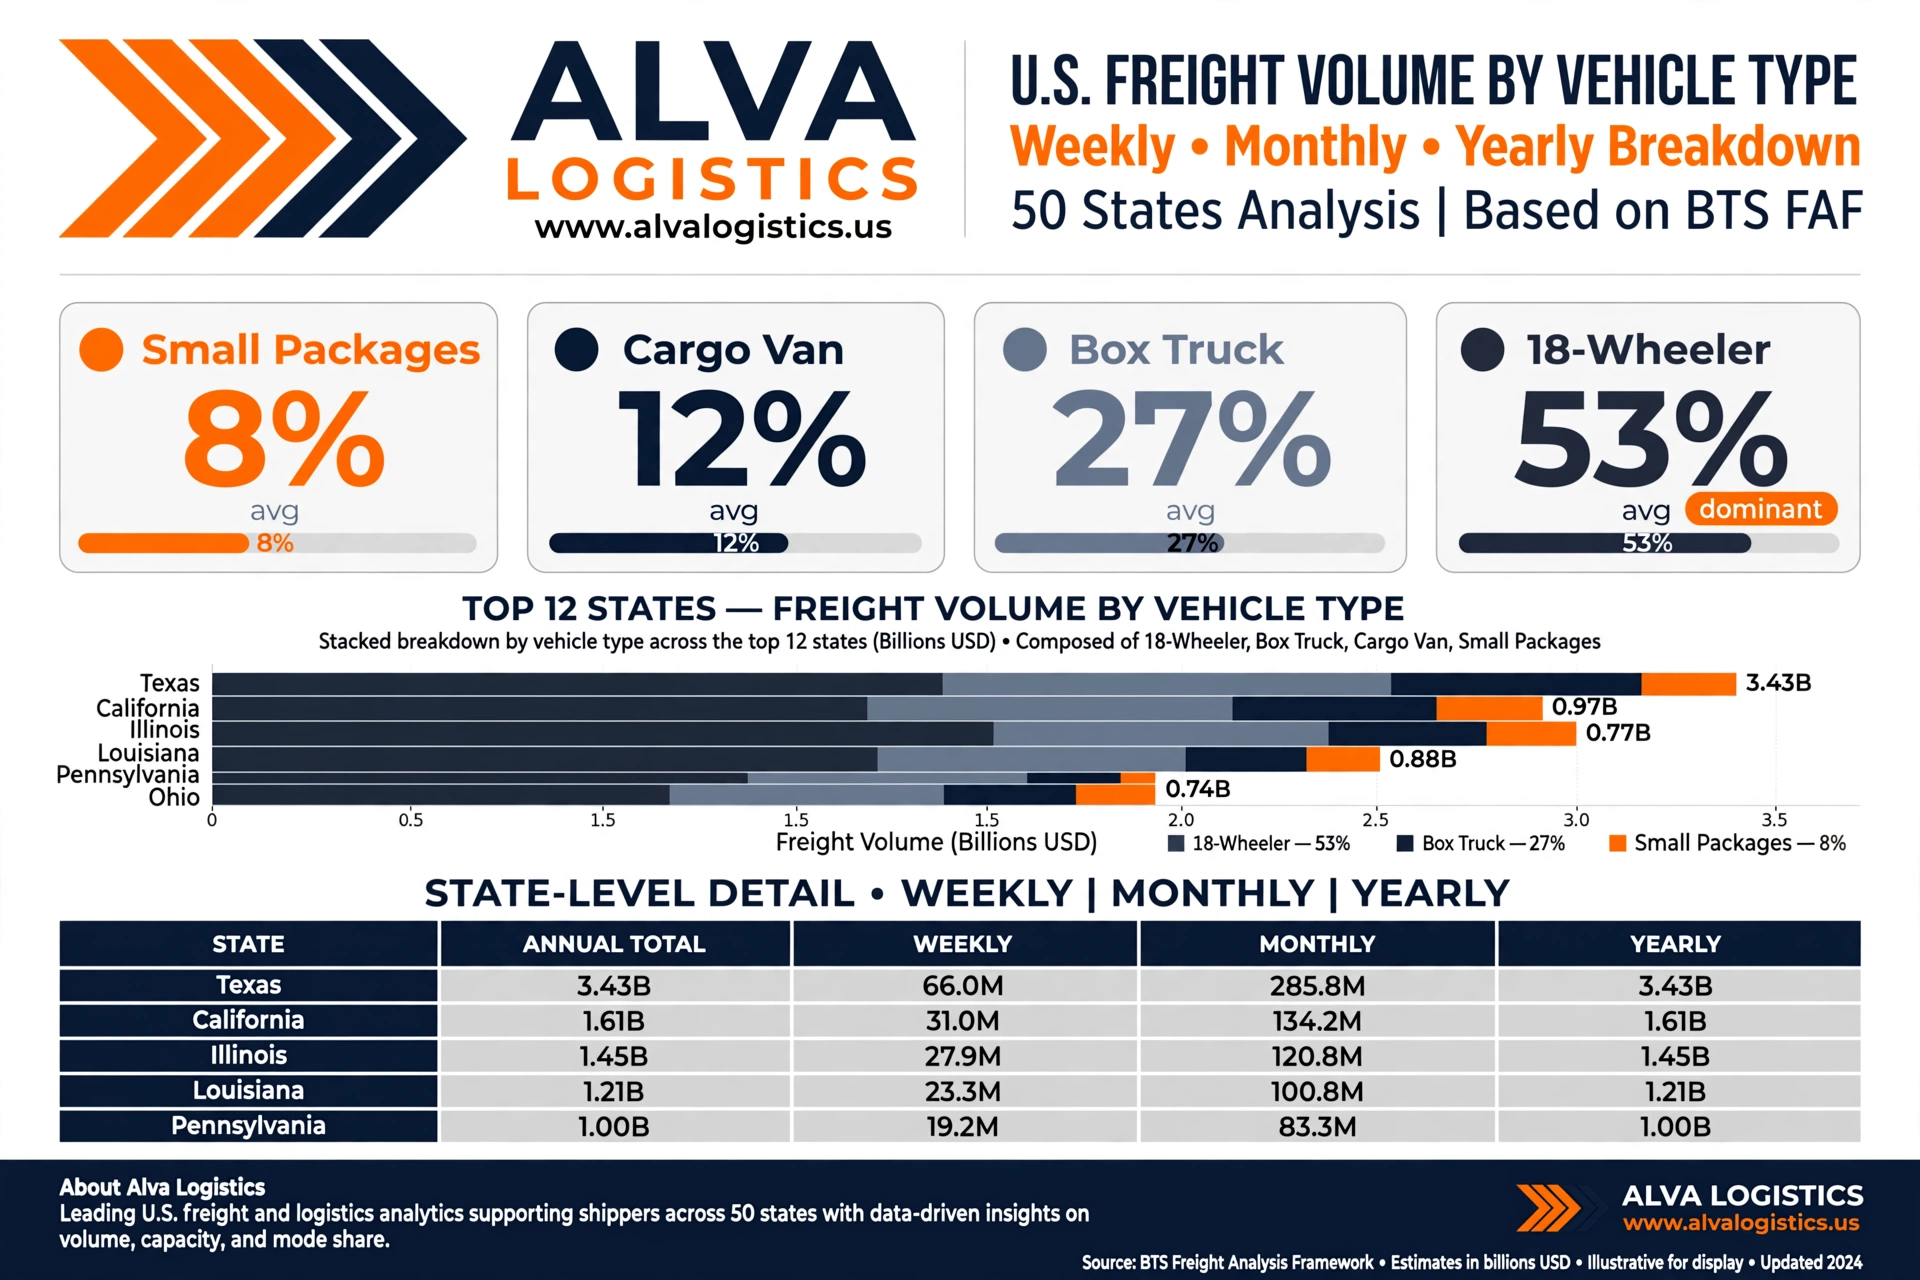
The American freight economy moves over 18.5 billion tons per year. But not all freight moves the same way. At Alva Logistics, we analyzed the latest Bureau of Transportation Statistics Freight Analysis Framework (FAF) data, adjusted for 2025 growth, to break down exactly how that freight moves — by small packages, cargo van, box truck, and 18-wheeler — in every single state, weekly, monthly, and yearly.
This isn’t just numbers. It’s where the opportunity is.
The National Picture: 53% Still Rides on 18 Wheels
Across the U.S., the freight mix by tonnage looks like this:
18-Wheeler (Class 8): 53% – ∼9.8 Billion Tons / Year
The backbone of American commerce. Despite talk of parcel growth, heavy long-haul still dominates.
Box Truck (Class 4-6): 27% – ∼5 Billion Tons
Regional distribution, LTL, furniture, white glove, and the critical middle mile.
Cargo Van: 12% – ∼2.2 Billion Tons
The fastest-growing segment for final-mile and expedited. Sprinter van loads are up 34% since 2020.
Small Packages (Parcel <150 lbs): 8% – ∼1.48 Billion Tons
Small in weight, massive in value and frequency. E-commerce driver.
Weekly, that means the U.S. moves roughly:
- 50.7M tons daily
- 356M tons weekly
- 1.54B tons monthly
Top States Tell Different Stories
Freight is not evenly distributed. The top 10 states move more than half the country.
1. Texas: 3.43B tons/year – 65.9M weekly
Texas is a beast of heavy haul. 65% is 18-wheeler freight, driven by oil, gas, construction, and cross-border freight from Laredo. Small packages are only 5% here — this is a tractor-trailer state.
2. California: 1.61B tons/year – 31M weekly
The opposite profile. 11% small packages and 15% cargo van due to LA, Bay Area, and Inland Empire e-commerce density. Box trucks at 28% feed the massive port-to-warehouse ecosystem.
3. Illinois: 1.45B tons/year – 28M weekly
Chicago is the freight crossroads of America. Balanced 51% 18-wheeler, with strong intermodal.
4. Louisiana: 1.21B tons/year
69% 18-wheeler — chemical, agricultural bulk, and port freight from New Orleans.
5. Pennsylvania & Ohio: ∼1B tons each
The Northeast manufacturing corridor — high box truck usage (28%) for regional retail replenishment.
What does this mean for carriers? If you’re running vans, you want to be in New Jersey (17% van freight), New York (16%), and Massachusetts. If you’re running 18-wheelers, Texas, North Dakota (73% 18-wheeler), Wyoming (78%), and Louisiana are your goldmines.
Weekly, Monthly, Yearly: Why It Matters
Most brokers quote yearly. Smart shippers plan weekly.
A shipper in Florida moving 16.9M tons weekly statewide can’t afford to think in annual averages. Hurricane season, produce season, and tourism all shift the vehicle mix month to month. In Florida, small packages spike to 12% in Q4, while box trucks dominate in spring.
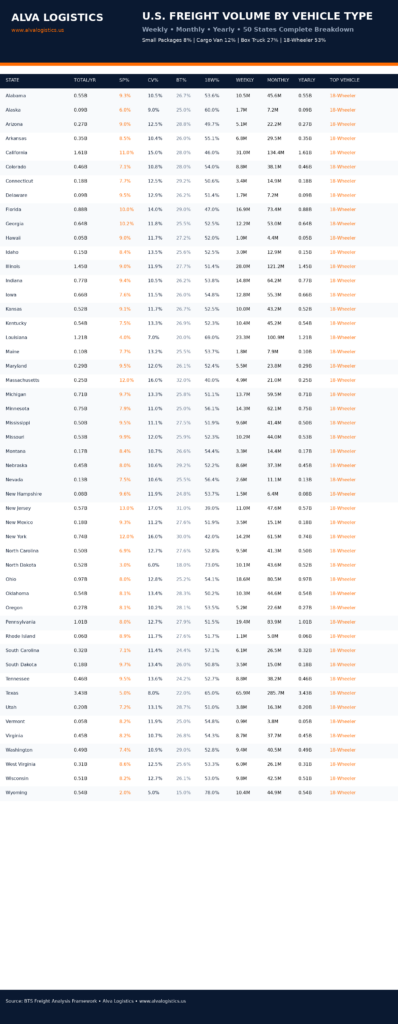
That’s why Alva Logistics built the full 50-state dataset with:
- Yearly Total for annual RFPs
- Monthly Total for seasonal capacity planning
- Weekly Total for dispatch and spot market decisions
- Vehicle-type % and tonnage for fleet matching
Every state has its dominant vehicle. We calculated it for you.
How Alva Logistics Uses This Data
We don’t just publish data — we dispatch by it.
- Fleet Placement: We position box trucks in New England where they are 30%+ of freight, and 18-wheelers along the I-10 and I-20 corridors where they are 65%+.
- Rate Forecasting: When we know Texas moves 285.7M tons monthly, we can predict when capacity will tighten.
- Customer Consulting: An e-commerce client shipping to New Jersey needs a different strategy (13% small parcel, 31% box truck) than an oilfield client in Wyoming.
This data is available as a downloadable spreadsheet and infographic set for our customers.
Download the Full Report
- Excel Dataset: 50 states x 4 vehicle types x weekly/monthly/yearly
- Infographic Pack: Horizontal summary, vertical Instagram story, and full tall poster with all 50 states
- Methodology: BTS FAF v4.5 2017 baseline + FHWA 2025 growth factor (12%) + vehicle class modeling by state economic profile and population density
At Alva Logistics, we don’t guess where freight is. We know.
If you’re a shipper moving freight in any of these 50 states, let’s talk about how to match your freight to the right vehicle at the right time.
Visit www.alvalogistics.us or call our dispatch in Freeport, NY for a lane analysis.
Source: U.S. DOT Bureau of Transportation Statistics, Freight Analysis Framework v4.5. Vehicle split modeled from FHWA Vehicle Classification, American Trucking Associations, and parcel industry data. 2025 estimates.


Leave a Reply